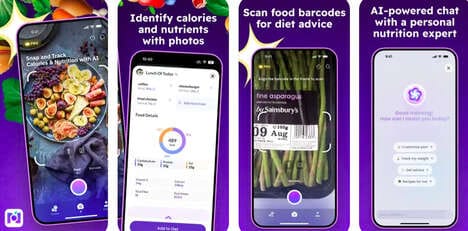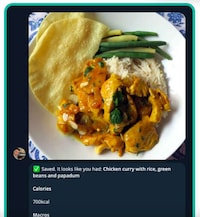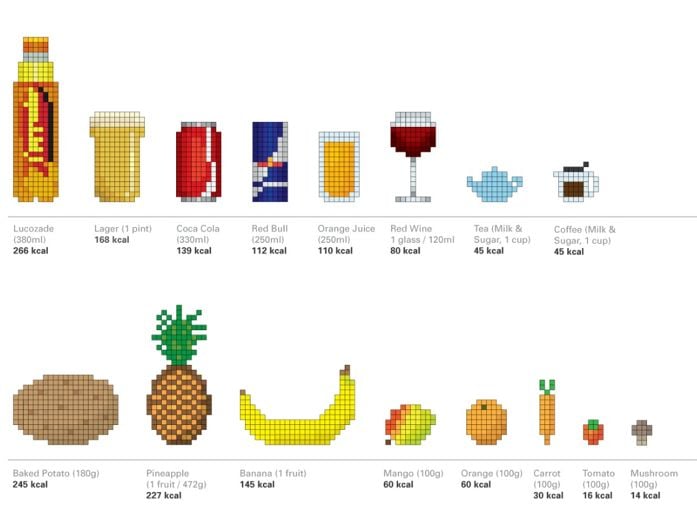
Keeping track of your calorie intake can truly be a daunting task. First of all, it is time consuming and second of all, who would want to expose just how many calories are in the bucket of fried chicken they scarfed down? Regardless, it is still a good way to maintain and keep track of your health
A Graphic designer, who goes by the name Severino R, recently created a chart that helps you better understand the amount of calories in popular foods. However, his chart is not a typical nutrition guide like the ones released by the government; his is completely pixelated and mathematical.
His goal was to "translate amounts of energy into some form of visual reference that people could understand and relate to." In turn, the chart is an A2 poster showing a list of food and drink items drawn out in pixel blocks, which each represent 1 kcal (calorie).
Key Themes Behind This Trend
- Pixelated Nutrition Visualization
- Opportunity for designers to create innovative ways of displaying nutritional information.
- Personalized Nutrition Tracking
- Potential for apps to utilize pixelated charts for ease of calorie tracking.
- Gamification of Nutrition
- Using pixelated charts to turn calorie tracking into a game or challenge.
Where This Applies
- Food and Beverage
- Opportunity for food and beverage companies to incorporate pixelated charts into packaging or marketing.
- Health and Wellness
- Pixelated nutritional charts can become a part of the wellness industry, allowing individuals to track their nutritional intake.
- Fitness Tech
- Fitness apps and devices can use pixelated nutritional charts to track calorie intake and progress.