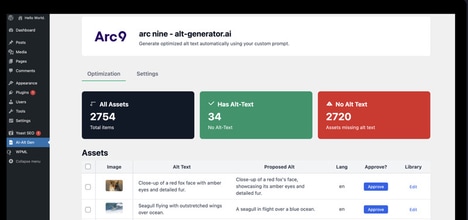

PNAS, the Proceedings of the National Academy of Sciences, has introduced alternative text descriptions for all published figures. The rollout of this accessibility feature will start with volume 123.
PNAS uses a hybrid process where generative artificial intelligence produces draft descriptions that scientific editors and authors then review for accuracy before final publication. Unlike traditional figure captions that explain methodological context or what a figure means, alternative text descriptions serve a different function by describing what the figure visually shows. This feature will allow screen readers to convey that information aloud to readers who are blind or have low vision. As such, researchers, students, and professionals who rely on assistive technologies will benefit from the removal of the longstanding barrier that has excluded them from accessing visual scientific data. This change also benefits authors who want their work to reach the widest possible audience.
Image Credit: PNAS
Why This Trend Is Growing
- AI-assisted Accessibility
- Generative models creating draft image descriptions enable scalable production of accessible content across large publishing backlogs.
- Standardized Figure Metadata
- A shift toward explicit, machine-readable descriptions of visual elements indicates opportunities for interoperable metadata schemas that improve discoverability and reuse.
- Inclusive Scientific Communication
- Broader adoption of descriptions that convey visual data fosters more equitable access to research outputs for readers using assistive technologies.
Industries Being Reshaped
- Academic Publishing
- Integration of reviewed AI-generated alt text into editorial workflows signals potential for new quality-control services and compliance tools tailored to accessibility standards.
- Assistive Technology
- Enhanced access to descriptive figure text suggests richer, more contextual user experiences for screen readers and multimodal assistive apps.
- Data Visualization Software
- The need for visuals that translate cleanly into textual descriptions points to demand for design tooling that pairs graphics with semantic description layers.