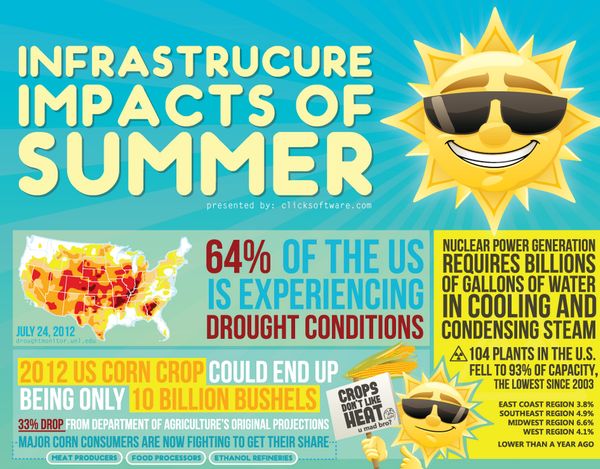
This weather-affecting infographic gives insight to when the economy is mostly affected due to the change in temperature.
It is based on the impact of summer and explains important facts like the average retail price of electricity and other points that may often be overlooked. For example, gas is more expensive in the summer because more people driving increases the demand and severe storms affect transport routes.
This infographic provides awareness, which is beneficial to consumers and bigger chains to prepare for the coming months; by showing the affects of summer, it will influence people to be more conservative with energy. If you know the statistics, then you will become more judgmental of what to avoid and how to accommodate for summer.
Why This Trend Is Growing
- Economical Impact of Summer
- As climate change becomes more prevalent, there is an opportunity for companies to cater to consumers looking to be more cost-effective during summer months.
- Visualizing Weather Impact
- Innovative technology could take this weather-affecting infographic to the next level, providing real-time and more comprehensive data for businesses to make decisions.
- Sustainable Energy Consumption
- This infographic sheds light on the impact of energy consumption during summer months, creating opportunities for companies to develop sustainable products and services to lower energy costs.
Industries Being Reshaped
- Energy
- Energy companies can use this infographic as a tool to promote sustainable energy consumption.
- Retail
- Retailers can use this data to better prepare for the financial impacts of summer and cater their products to the more cost-conscious consumer.
- Transportation
- Transportation companies can utilize this information to better plan for the effects of severe weather on their routes and supply chains.