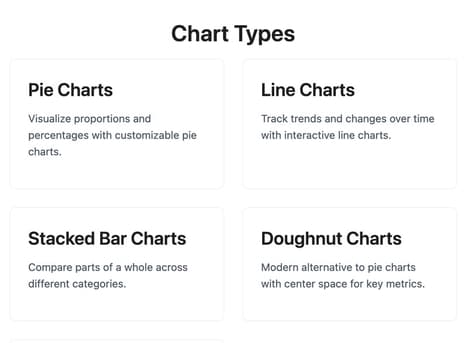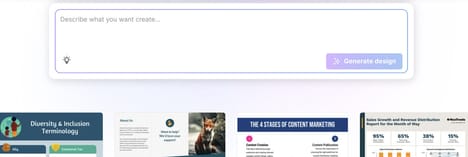

Vizblock is a WordPress plugin designed for users of the Gutenberg editor who want to embed clean, minimal charts directly into their content. It supports multiple chart types — including bar, line, and pie — allowing content creators to visually represent data without relying on external tools or complex integrations.
By streamlining the chart creation process, Vizblock reduces design friction and increases accessibility for non-technical users. This plugin is especially useful for bloggers, small businesses, and marketing teams who need to present data in a visually compelling format within their existing WordPress workflow. As data-driven storytelling becomes more critical in digital content, tools like Vizblock help bridge the gap between simplicity and functionality, offering a fast, native way to enhance visual communication on WordPress sites.
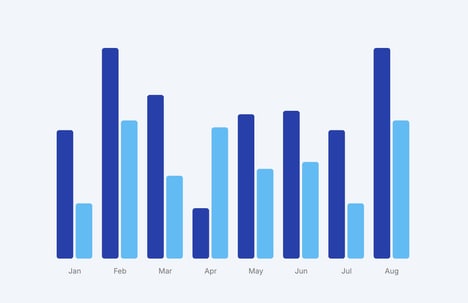
Image Credit: Vizblock
Key Themes Behind This Trend
- Simplified Data Integration
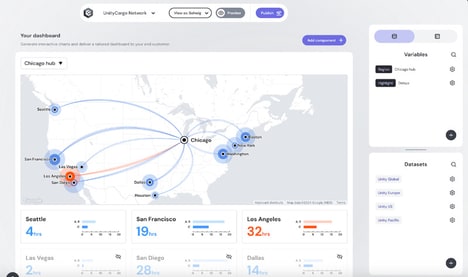
- The rise of plugins like Vizblock emphasizes the demand for streamlined data visualization solutions that simplify the integration of complex data into web content without external dependencies.
- Interactive Data Storytelling
- Interactive charts embedded in everyday content herald a shift towards more engaging and dynamic data presentations, making narratives more compelling for audiences.
- Minimalist Visualization Tools
- The trend towards minimalistic visualization tools allows for clean, user-friendly data representation that enhances the accessibility and readability of data in digital media.
Where This Applies
- Content Management Systems
- As content management systems evolve, the integration of embedded data visualization tools opens new avenues for enhancing user engagement and simplifying web design processes.
- Digital Marketing
- Embedded visualization tools provide digital marketers with innovative ways to present complex data, offering potential for more impactful storytelling and audience engagement.
- Small Business Software
- The inclusion of user-friendly visualization features in small business software empowers owners to leverage data insights without needing advanced technical skills, thereby enhancing operational efficiency.