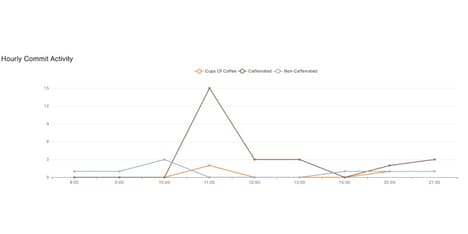

Spurious correlations by Tyler Vigen is a website that allows visitors to select from amongst a plethora of variables that although correlate, they ultimately have nothing to do with one another.
In our current information age we are constantly being bombarded with data, and as a result we can be easily fooled into forming causal links between these pieces of correlating data. Spurious correlations is a hilarious site with an important lesson to be learned; though we may be able to use technology to further collect and compare information, ultimately we must use our own human faculties when it comes to interpreting and understanding these data points.
Examples of spurious correlations found on the site include: the marriage rate in Kentucky correlating with the number of fishing boat drownings, and the consumption of mozzarella cheese with the number of engineering doctorates awarded.
What Makes This Trend Stand Out
- Data Misinterpretation
- Opportunity for disruptive innovation in developing tools and techniques to effectively interpret data and avoid forming erroneous correlations.
- Causal Link Fallacy
- Opportunity for disruptive innovation in educating individuals on the importance of critical thinking and avoiding the assumption of causation based on correlating data.
- Human Judgment in Data Analysis
- Opportunity for disruptive innovation in creating AI-powered tools that augment human judgment in interpreting and understanding data, reducing the likelihood of spurious correlations.
Sectors Adopting This
- Data Analytics
- Opportunity for disruptive innovation in developing advanced analysis techniques and algorithms to identify and filter out spurious correlations from large datasets.
- Education and Training
- Opportunity for disruptive innovation in creating educational programs and resources that help individuals develop critical thinking skills and avoid falling prey to misleading correlations.
- Artificial Intelligence
- Opportunity for disruptive innovation in building AI systems that assist human analysts in detecting and validating correlations, enabling more accurate data interpretation and decision-making.