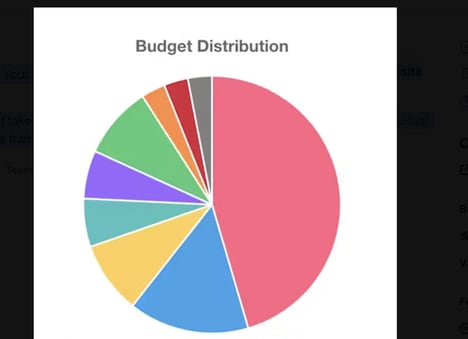

The NPR chart examines how money is spent in different income brackets. The study provides interesting spending behavior, and highlights the differences and similarities between the poor, the middle class and the rich within the United States of America.
According to the data presented, those with higher incomes are more likely to eat out, spend on entertainment and save money for retirement. On the opposite side of the spectrum, the poor are most likely to prepare meals at home. A huge portion of income is put towards housing, transportation and gasoline, and the same is true of the middle class. The most evident commonality among the three divisions is the amount spent on shoes and clothing.
What's Driving This Trend
- Changing Spending Habits
- Analyzing spending behavior across income brackets can reveal shifts in consumer priorities and offer opportunities for businesses to adapt their products and services.
- Income-based Consumption
- Understanding how income affects spending can help businesses tailor their marketing strategies to specific income groups.
- Redefining the Middle Class
- Exploring the spending patterns of the middle class can inform companies on how to target this large consumer segment.
Who This Affects Most
- Food and Beverage
- As income levels impact dining preferences, restaurants and food delivery services can develop innovative strategies to meet the changing needs of different income groups.
- Housing and Transportation
- The data on spending for housing and transportation offers opportunities for real estate developers, ride-sharing platforms, and automobile manufacturers to cater to the demands and budgets of various income brackets.
- Fashion and Retail
- The common spending on shoes and clothing in all income brackets presents opportunities for retailers to offer affordable yet stylish options for consumers across different income levels.