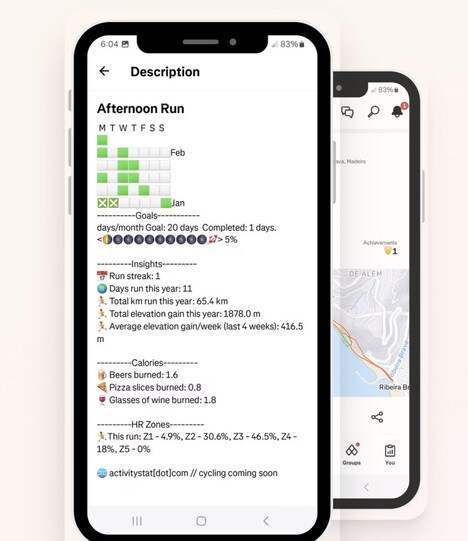

Nike has released a series of infographics -- put together from data obtained through the NikeFuel activity tracking system -- which show how weather conditions influence the activity levels of amateur athletes across the USA. The graphics are based on NikeFuel-generated data obtained through the so-called Nike+ ecosystem and Nike+ apps such as Nike+ Running, Nike+ Training Club, Nike+ FuelBand, and Nike+ Move.
The infographic shows that the perfect temperature range for physical activity in the US is between 60 and 70 degrees Fahrenheit (between 15.5 and 21.1 degrees Centigrade), while the 'sweet spot' -- the peak physical activity temperature -- US is 66 degrees Fahrenheit (18.9 degrees Centigrade).
The infographics offer comparisons on activity levels between cities. Portland was found to be more active than Seattle, while Las Vegas bested Phoenix in the comparison of the desert cities.
What Makes This Trend Stand Out
- Activity Tracking Systems
- The rise of activity tracking systems like NikeFuel presents opportunities for further innovation in data collection and analysis.
- Weather-influenced Activity
- Understanding the impact of weather conditions on physical activity can open up new possibilities for optimizing performance and motivation in athletes.
- City-based Activity Comparisons
- Comparing activity levels between cities offers insights for urban planning, wellness initiatives, and targeted marketing strategies.
Sectors Adopting This
- Fitness Technology
- Fitness technology companies can capitalize on the demand for activity tracking systems and develop more advanced and user-friendly products.
- Weather Services
- Weather service providers can partner with activity tracking platforms to leverage weather data in optimizing users' physical activities and performance.
- Urban Planning and Wellness
- Urban planning agencies and wellness organizations can use city-based activity comparisons to inform the development of healthier and more active communities.