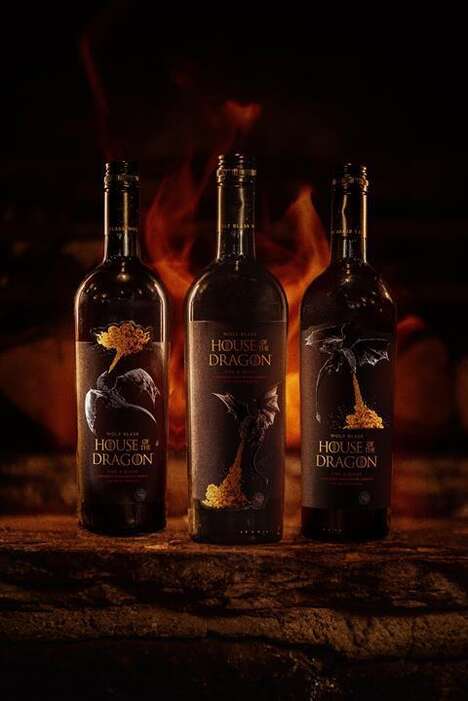
If you can't wait to find out each week which Game of Thrones character dies or see which characters consummate incest, then these hilariously ironic Game of Thrones infographics are the perfect read for you.
These Game of Thrones infographics cleverly parody the hit fantasy series' gory plot lines with quirky stick figure graphics, basic venn diagrams, colorful bar graphs and simple GIF animations. The infographics humorously poke fun at many of the show's unexplained and detailed plot twists in a way that will make any Game of Thrones mega-fan laugh.
For example, one graph called 'How I Spend My Time' shows Arya Stark's rotating head spinning around an entirely blue circle to showcase that she spends all of her time on the show "looking for my family." Another funny infographic uses a chart to deduce if Game of Thrones characters can trust one another. The final verdict is whether or not they're a blood relation, characters cannot trust them in the battle for the Iron Throne.
What's Driving This Trend
- Satirical Infographics
- Disruptive innovation opportunity: Create satirical infographics that parody popular TV shows and movies, attracting a niche audience.
- Quirky Stick Figure Graphics
- Disruptive innovation opportunity: Develop unique stick figure graphics to add humor and satire to various types of content, enhancing engagement.
- Simple GIF Animations
- Disruptive innovation opportunity: Use simple GIF animations to create humorous and creative visuals, capturing the attention of online audiences.
Who This Affects Most
- Entertainment
- Disruptive innovation opportunity: Create satirical infographics and humorous content specifically targeted towards entertainment enthusiasts.
- Digital Marketing
- Disruptive innovation opportunity: Incorporate quirky stick figure graphics and GIF animations into digital marketing strategies to stand out and engage with audiences.
- Graphic Design
- Disruptive innovation opportunity: Use satirical infographics and unique visuals to push the boundaries of traditional graphic design, offering a fresh and humorous approach.