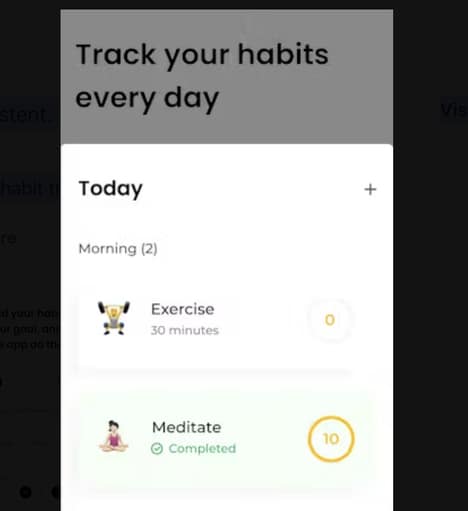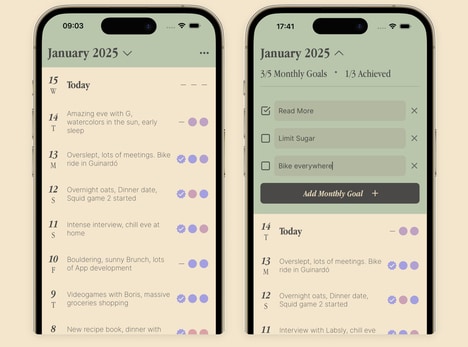
CLY Pixel offers a structured way to visualize personal data over the course of a year using a colour-coded pixel grid. By tracking habits, moods, or daily activities, users can build a high-level overview of behavioural patterns that might otherwise be difficult to identify.
From a business perspective, tools like this reflect a broader trend toward self-quantification and simplified data interpretation. The pixel-based layout enables consistent daily inputs without requiring extensive time or detail, which can increase user adherence. While primarily focused on personal use, the underlying approach aligns with workplace wellness strategies and goal-tracking methodologies that emphasize routine, accountability, and visual reporting. CLY Pixel demonstrates how lightweight data-tracking interfaces can support long-term habit formation and provide meaningful insights through minimal interaction.
Image Credit: CLY Pixel
Why This Trend Is Growing
- Self-quantification Evolution
- The trend of self-quantification is growing as individuals increasingly seek to transform qualitative habits into quantitative visual overviews.
- Simplified Data Visualization
- The demand for intuitive and user-friendly visual tools that simplify complex data sets into easily digestible formats is on the rise.
- Personalized Insight Generation
- An increasing emphasis on personalized insights through minimalist data input systems is shaping how users perceive and interact with daily habit tracking.
Industries Being Reshaped
- Workplace Wellness Solutions
- Incorporating visual habit tracking methodologies into workplace wellness programs could revolutionize how employee health and productivity are monitored.
- Data-driven Lifestyle Apps
- The growth of apps focusing on lifestyle management and improvement is propelled by innovations in data visualization and tracking technologies.
- Behavioral Analytics Tools
- New opportunities emerge in behavioral analytics by utilizing minimalist interfaces that capture user data with minimal friction for deep insights.