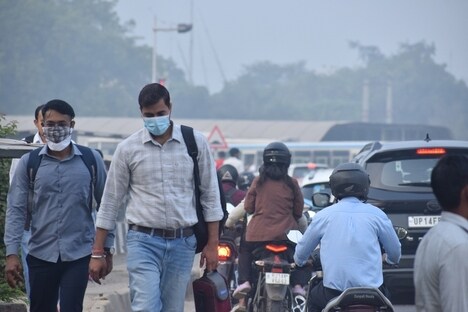
This web app is intended to address air quality forecasting in New York City. Patrick Miller and David Markel developed ForcecastAer as part of the NYC BigApps challenge to address local issues. In an effort to provide an environmental solution, the site involved building models to predict air quality and visualizing the data based on an index.
The air quality forecasting technology utilizes data from the New York State Department of Environmental Conservation and combines it with GPS technology to indicate where pockets of fresh air exist in New York City. The areas are ranked from hazardous to good, informing citizens of potentially unhealthy areas of the Big Apple.
This is very similar to PerkinElmer's air quality networks, which also acts as an air pollution map.
What's Driving This Trend
- Air Quality Forecasting
- Develop predictive models to forecast air quality levels for urban areas.
- Environmental Data Visualization
- Create interactive maps and visualizations to increase public awareness of air pollution levels.
- Gps-based Air Quality Monitoring
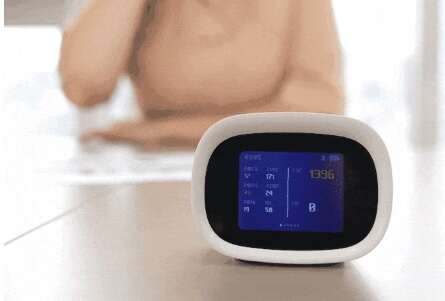
- Develop GPS-based air quality monitors to measure air quality levels in real-time.
Who This Affects Most
- Environmental Monitoring
- Create innovative technologies and solutions to monitor and address air pollution issues.
- Smart City Solutions
- Integrate air quality forecasting and monitoring technologies into smart city infrastructure to improve public health.
- Data Analytics
- Develop and utilize data analytics tools to analyze large amounts of air quality data and identify trends.