#1 in Trends Become a Trend Hunter:   Login or Join Now   Add a Trend
Trends Logo
   ALL    Tech    Fashion    Sex    Pop Culture    Celebs    Ads    Business    Eco    Art & Design    Life    Luxury    Science    Bizarre   More [+/-]
Marissa BrassfieldMarissa Brassfield
3,488 Trends
8,804,000 Views
4,120 Comments

SUBSCRIBE
Twitter Trends
Facebook Trends
Trend Report Newsletter
Trend Hunter TV
Trend Hunter Mobile
Trend Hunter RSS


Visual Election Polls Edit
University of Utah Makes the Pie Chart Interactive


Digg this TrendStumble this TrendShare this TrendEmailthis TrendEmbed This TrendShare This Trend


Visual Election Polls
University of Utah Makes the Pie Chart Interactive
Visual Election Polls - University of Utah Makes the Pie Chart Interactive (GALLERY) 2
Visual Election Polls - University of Utah Makes the Pie Chart Interactive (GALLERY) 3
Visual Election Polls - University of Utah Makes the Pie Chart Interactive (GALLERY) 4
Visual Election Polls - University of Utah Makes the Pie Chart Interactive (GALLERY) 5
Visual Election Polls - University of Utah Makes the Pie Chart Interactive (GALLERY) 6
Visual Election Polls - University of Utah Makes the Pie Chart Interactive (GALLERY) 7
Visual Election Polls - University of Utah Makes the Pie Chart Interactive (GALLERY) 8

Visual Election Polls - University of Utah Makes the Pie Chart Interactive (GALLERY)
University of Utah Makes the Pie Chart Interactive
Published: Oct 6, 08
Views: 5,937

The 2008 presidential election has made everyone a political pundit, but up until now, election polls have been hard to categorize and break down. Most of the election polls that are on television are fine for most people; they show the general aggregated numbers, and some go a step further and break them down by gender. But those general numbers aren’t enough to satisfy journalists or otherwise inquisitive people.

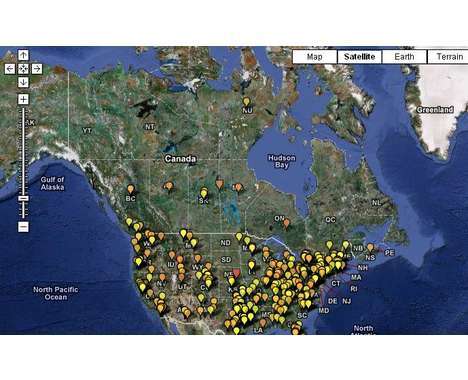
The University of Utah has created software that will make decoding election polls far easier. Want to know how full-time versus part-time students in a college town in the Midwest—or upstate California, for that matter—plan to vote? Simply drag and drop your selected parameters into the radial chart, and data from election polls will readjust accordingly.

Want to manipulate information from election polls to see how black women with incomes over $50,000 plan to vote? You can do that too. The drag-and-drop functionality of the software created by the University of Utah ensures the radial chart will repopulate immediately.

"Right now it is an academic project. My goal is to get the idea out there and let other software developers incorporate our visual methods into their products. The software would be useful for news reporters to go on the air and move the icons around and show how different demographic groups voted, how they feel about certain issues. Eventually, it might be used by the general public." (eurekalert.org)

References:  eurekalert.org

Filed In:  political science social


Related


Reactions

FOUR WAYS TO REACT: vote, favorite, add more examples of Visual Election Polls or comment about University of Utah Makes the Pie Chart Interactive.


Welcome Back!

New? Sign-up FREE [+/-]

Username
Remember Me!
Password
Forgot your password?


Become a Trend Hunter

Already a Member? Log in HERE [+/-]
Username &
Portfolio URL
TrendHunter.com/
Full Name
Password
Password Confirm
E-Mail Address
You will be sent a confirmation e-mail to complete registration.

 Subscribe to our FREE Weekly Trend Newsletter
         Privacy by SafeSubscribe

 I agree to the Terms of Service

Terms of Services

All messages posted at this site express the views of the authors, and do not necessarily reflect the views of the owners and administrators of this site. By registering at this site you agree not to post any messages that are copyright violations, obscene, vulgar, slanderous, hateful, threatening, or that violate any laws. We will permanently ban all users who do so.

We reserve the right to remove, edit, or move any post for any reason. Our terms of service are subject to change without notice. Potential changes could relate to the layout, content, and / or revenue sharing. Content added to Trend Hunter may be edited before publication and becomes property of Trend Hunter Inc. Trend Hunter Portfolios could be removed or banned at any time, which could occur due to copyright violation, click fraud, abuse of any of our rules or for any other reason.


Submit the word you see below:


TREND HUNTER
is the world's largest trend spotting and cool hunting community. It is an explosion of cool trends and ideas, fueled by a global network of trend spotters and cool hunters. By tracking the evolution of cool, Trend Hunters stimulate creativity and generate breakthrough ideas.

About Us   Trends   Trend Reports   Tools   Store   RSS (98 Flavors)   Innovation Keynotes   Exploiting Chaos   Terms of Use   Tips / Contact     Join
4.3099 - Hosted by web3
Trends and Content Copyright © TREND HUNTER Inc. All Rights Reserved.
Visual Election Polls