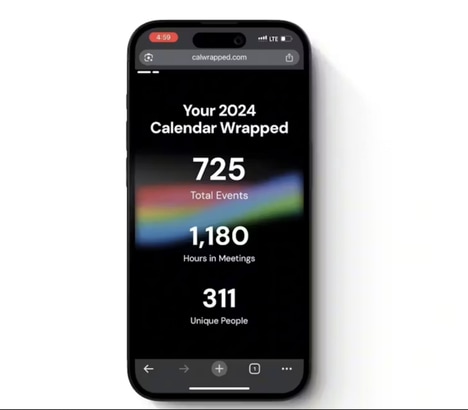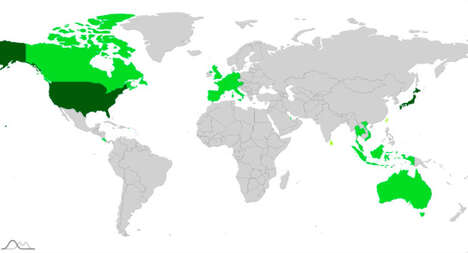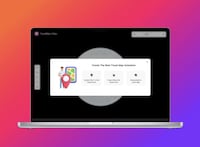

Travel Wrapped is a digital tool that converts a traveler’s annual journeys into a visually engaging, shareable infographic. Users input trip details — such as destinations, dates, and experiences — and the platform compiles the information into a cohesive, personalized visual summary.
Designed with social media in mind, the infographic allows individuals to showcase their travel highlights while providing a creative way to document personal milestones. For businesses, such as travel agencies or tourism boards, the concept offers potential for customer engagement, branded content, or marketing campaigns that leverage user-generated experiences. Beyond aesthetics, the approach taps into the trend of digital storytelling, allowing users to reflect on their year while sharing a polished, data-driven narrative of their adventures with their online communities.
Image Credit: Travel Wrapped
What's Driving This Trend
- Personalized Travel Infographics
- Custom-built infographics for travelers enable enhanced storytelling, offering users a new medium to chronicle and immortalize their journeys visually.
- Digital Storytelling Evolution
- The convergence of data and design transforms travel documentation into a captivating narrative form that resonates deeply with social media audiences.
- User-generated Content Leverage
- Harnessing travelers' own experiences in visually rich formats presents a dynamic resource for brands seeking authentic marketing content.
Who This Affects Most
- Travel and Tourism
- Integration of infographic tools can revolutionize customer engagement, allowing players in this sector to offer innovative, shareable content that aligns with digital behaviors.
- Social Media Platforms
- Platforms can benefit from incorporating advanced visual storytelling features, fostering richer user interaction and content diversity.
- Graphic Design Technology
- This growing demand for personal visual narratives creates an opening for design software developers to provide more intuitive, user-friendly tools.