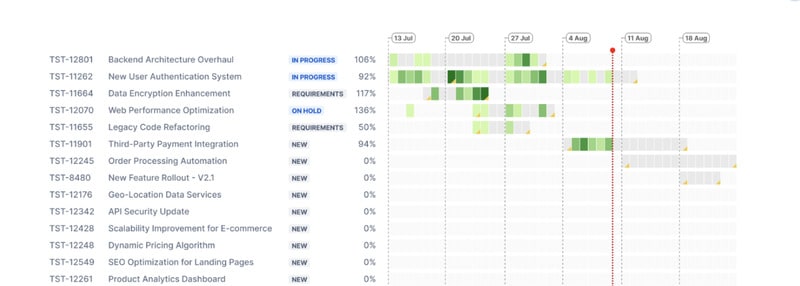
Focus Flow is a work analytics tool designed to help teams understand how time is actually spent across projects and epics. By generating heat-mapped timelines based on logged effort, the platform provides a visual representation of workload distribution and delivery patterns.
This approach allows teams and managers to move beyond estimates and gain data-driven insight into execution, bottlenecks, and focus areas. Grouping activity by epics helps align time investment with strategic priorities, making it easier to evaluate whether resources are being applied where they deliver the most value. For business and product leaders, Focus Flow supports more informed planning, forecasting, and retrospective analysis. By connecting time spent directly to outcomes, the tool encourages transparency and continuous improvement in how teams plan, execute, and deliver work.
Image Credit: Focus Flow
What Makes This Trend Stand Out
- Epic-based Analysis
- Epic-based analysis aids in aligning team efforts with strategic goals by evaluating resource allocation and value delivery.
- Heat-mapped Work Tracking
- Heat-mapped work tracking offers comprehensive insights into workload distribution and delivery timing, transforming project management observation.
- Data-driven Execution Insight
- Data-driven execution insight enhances transparency and continuous improvement by linking time investment directly to project outcomes.
Sectors Adopting This
- Work Analytics Software
- Work analytics software unlocks potential for enhanced team productivity by visualizing and analyzing time usage and project delivery.
- Project Management Tools
- Project management tools integrate advanced visualization to refine planning and execution strategies based on in-depth data insights.
- Business Intelligence Services
- Business intelligence services enable strategic decision-making by providing clear, visualized data on team performance and resource efficiency.