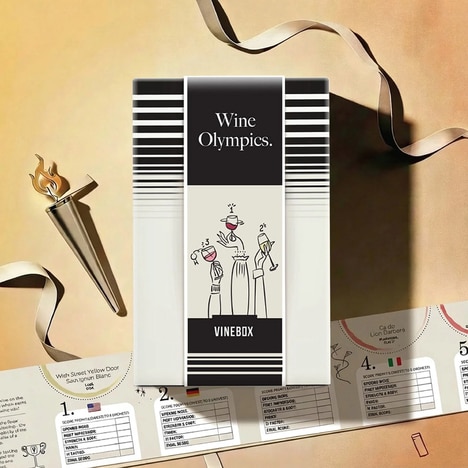

Figuring out what the best bottle is for a dinner or casual evening at home is tricky, but this top wines of 2012 infographic can help make the decision a little easier.
Starting off with the varying kinds of wine available, the chart goes on to detail which countries produced the best varieties during the 2012 year. Price points are naturally one of the most important characteristics as being too high or too low can be detrimental to marketing and sales; those on a budget spend about $16 per bottle, the average drinker about $49 and those who like to splurge will shell out around $208 a pop.
The chart finishes off with some past selections and encourages connoisseurs to branch out with their typical choices for optimal enjoyment.
Key Themes Behind This Trend
- Location-based Wine Recommendations
- Developing wine recommendation algorithms and apps that take into account the country, region or vineyard of the wine to provide customized wine recommendations
- Affordable Luxury Wines
- Creating a line of premium quality wines that are currently offered at a high price point but available at a more affordable price for a wider audience
- Wine Education and Discovery
- Develop an online platform or app that provides wine education and tasting classes, and helps users discover new wines based on their preferences and budget
Where This Applies
- Wine Retailers
- Provide an efficient way for customers to receive personalized wine recommendations, and have access to pre-made charts like the top wines of 2012, to increase customer engagement and loyalty
- Food and Hospitality
- Partner with wine retailers to provide wine recommendations to their customers, and offer wine tasting events to educate their customers and increase revenue
- Technology
- Develop and market an artificial intelligence platform specifically for the wine industry to provide automated recommendations based on customer preferences, budget, and location