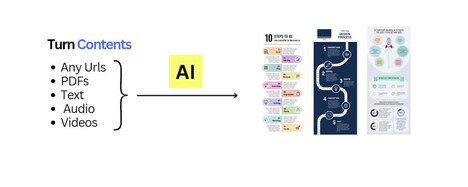

With the release of this infographic information chart, infographics have officially lapped themselves.
If you're still in the dark about how to create a good one, you can get step-by-step guidelines here.
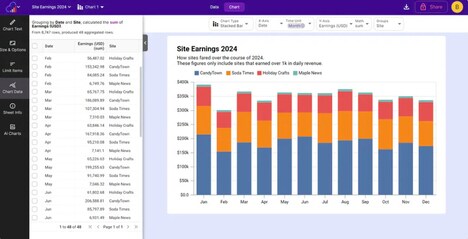
The first step is research and clarifying your mission. You need to think about what you want your infographic to say and accomplish. Don't get bogged down in endless, disconnected data that leaves the reader forgetting the actual point.
The next stage is design, which is obviously of equal importance since an infographic is part visual and part academic. The great thing about infographics is how they display information in a visually stimulating way. Previously boring information can now be infused with a sense of originality with this layout.
Why This Trend Is Growing
- Interactive Infographics
- The use of interactive and dynamic elements in infographics can increase viewer engagement and make data more memorable.
- Personalized Infographics
- The creation of customized infographics based on user data can provide a unique and personalized experience.
- Mobile-first Infographics
- Designing infographics that are specifically catered to mobile devices can provide a better user experience for on-the-go viewers.
Industries Being Reshaped
- Marketing
- The use of interactive and personalized infographics can help companies stand out and communicate information to their target audience in a more memorable way.
- Education
- Creating mobile-first infographics can help students and educators access and understand complex information more easily.
- Journalism
- Dynamic and interactive infographics can provide a more engaging and informative way for news outlets to present information to their readers.