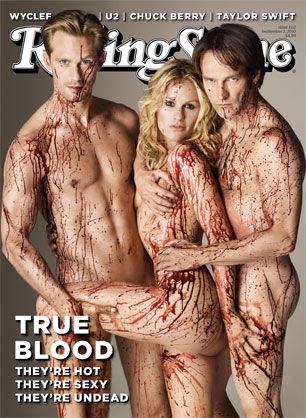

This True Blood infographic details the extensive history of this hit television series.
Based on a book series and set in the deep South, True Blood took off in a big way and is one of HBOs most popular franchises. With a cult-like following and extremely specific details in the writing of the show, viewers feel a special connection to the series and follow it very closely. This infographic breaks down the characters and happenings of each season, and is a good reminder for those who may have fallen behind on the show. With so many characters with so many different abilities, it's great that there's a highly visual medium that can be used as a reference.
Sure to please die-hard fans, this infographic is bloody brilliant and likely to go viral.
What's Driving This Trend
- Fan-centric Infographics
- The creation of more highly visual infographics for TV show fanbases can lead to increased engagement and virality.
- Detailed Character Histories
- Creating detailed character histories for TV shows, like in this True Blood infographic, can cultivate a cult-like following.
- Adapting Book Series
- TV shows adapted from book series, like True Blood, can attract a pre-constructed fanbase ready for engagement opportunities.
Who This Affects Most
- Television
- TV shows can benefit from creating highly detailed infographics to engage and excite their fanbases.
- Publishing
- Book series adaptations can attract fans that are already invested in the characters and storylines, offering new engagement opportunities.
- Marketing and Advertising
- The use of detailed infographics can be utilized within marketing and advertising campaigns to increase engagement and virality.