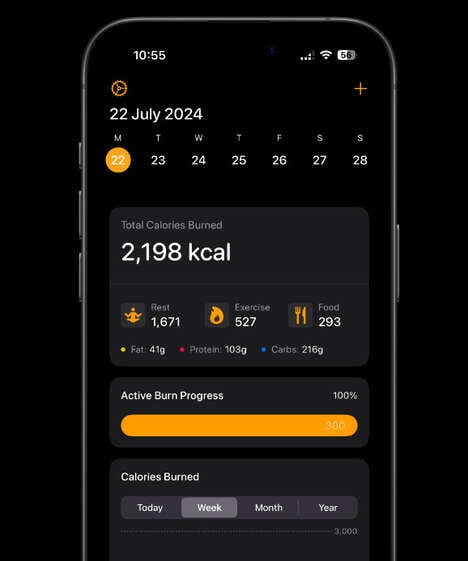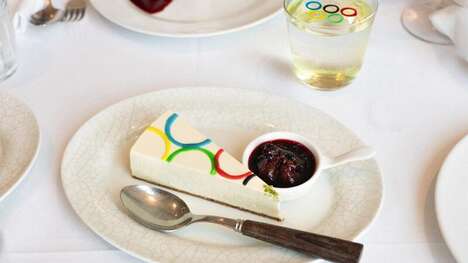

This olympic athlete calorie infographic is a colorful run-down of how much energy competitors use when performing in their respective events.
From the surprisingly low 35 calories burned in the men's 200 meter freestyle to the colossal 2,500 burned by marathon runners, there's a huge range in terms of how much energy each event requires. To put the numbers into a more clear context, the infographic goes on to explain how much food is equivalent to the amount of calories burned. In the case of marathon runners, the answer is five Big Macs! The chart ends by explaining the amount of time involved in each sport, often coming in at a number measured by seconds.
Proving that the games are an exhausting endeavor, this chart is an entertaining read for any Olympics enthusiast.
Why This Trend Is Growing
- Caloric Exertion
- Opportunities for developing innovative fitness programs and products that optimize caloric burn during different activities.
- Contextual Calorie Comparison
- Potential for food and nutrition companies to create products or campaigns that help consumers understand the relationship between calories burned and food consumption.
- Time-driven Performance
- Possibilities for technology companies to develop tools and software that track and analyze athletes' performance based on time metrics in different sports.
Industries Being Reshaped
- Fitness
- Opportunities for fitness centers, personal trainers, and fitness equipment manufacturers to cater to the specific caloric demands of different sports and training programs.
- Food and Nutrition
- Potential for food and nutrition companies to create specialized meal plans and nutritional supplements tailored to the energy requirements of different sports and activities.
- Sports Technology
- Possibilities for sports technology companies to develop wearable devices and performance tracking software that focus on time-driven performance analysis for athletes.