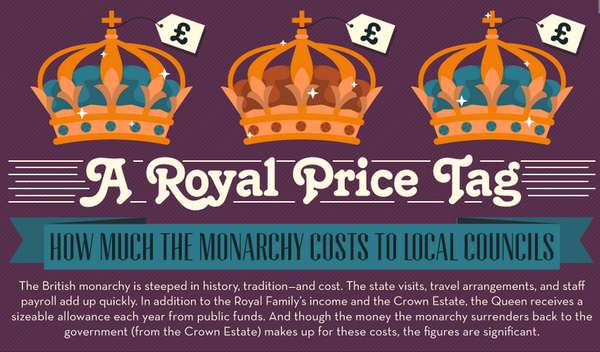
The Royal Price Tag infographic tells a tale of extravagant spending on the part of the Royals using the tax dollars of the British public. However, as a tradition, the Monarchy of Britain is incredibly traditional and duty-filled. Put on a public allowance, this infographic shows exactly where these funds are being spent.
In 2011, the Monarch of Britain spent $39.9 million dollars. Household expenses, staff pays, travel and property services eat into a large portion, but what this infographic is actually missing is the taxpayer-funded wedding of Prince William and Duchess Kate Middleton.
Gardening, catering and alcohol, you might be surprised to find, are huge expenses of the government. Considering the debate surrounding the relevancy of the Queen and the monarchy in this day and age, these expenses are sure to be met with two sides of opinion.
What's Driving This Trend
- Extravagant Spending
- The trend of extravagant spending by governments and organizations has potential opportunities for disruptive innovation in budgeting and financial management.
- Transparency in Spending
- The trend of increasing transparency in government and organizational spending presents opportunities for disruptive innovation in data analysis and visualization.
- Re-evaluation of Traditional Institutions
- The trend of re-evaluating the relevancy of traditional institutions, such as the monarchy, presents opportunities for disruptive innovation in social and political systems.
Who This Affects Most
- Government
- There is potential for disruptive innovation in the budgeting and financial management practices of government agencies and departments.
- Financial Services
- Increased transparency in spending practices presents opportunities for disruptive innovation in financial data analysis and visualization.
- Media
- Continued debate around traditional institutions and their relevancy creates opportunities for disruptive innovation in media coverage and analysis of social and political issues.