The Scale of Starbucks infographic is the perfect depiction of just how large this mega-brand coffee store is.
The Scale of Starbucks infographic provides a few pretty interesting facts. For instance, through this series, you will find out that Starbucks was originally purchased for $3.8 million dollars, and now turns a profit of $10.71 billion (est. 2010).
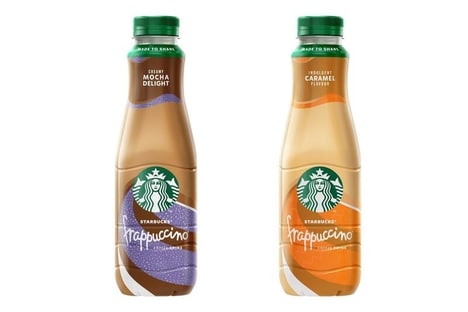
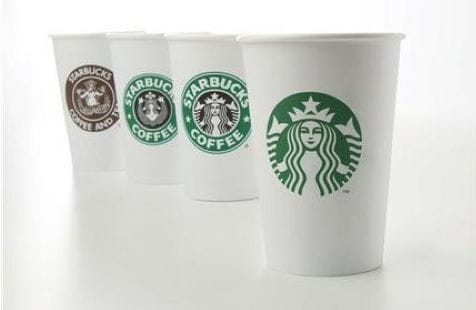
The iconic coffee place has also managed to include over 87,000 different drink combinations with its menu. Further, you will also see that the brand recently dared to be different and eliminated all the writing in its logo, leaving only the mermaid image, showing how it is an easily recognizable brand.
The Scale of Starbucks infographic is a great inspiration for any business that is starting out. It shows how a simple concept can go a long way.
Key Themes Behind This Trend
- Mega-brand Coffee
- The Scale of Starbucks infographic highlights the power and scale of mega-brand coffee stores, presenting disruptive opportunities for businesses in this industry.
- Iconic Branding
- The minimalist logo redesign showcased in The Scale of Starbucks infographic demonstrates the value of iconic branding, offering disruptive innovation opportunities for businesses looking to establish strong brand recognition.
- Customer Customization
- The 87,000 different drink combinations featured in The Scale of Starbucks infographic exemplify the growing trend of customer customization in the coffee industry, presenting disruptive innovation opportunities for businesses that prioritize personalized experiences.
Where This Applies
- Coffee Retail
- The Scale of Starbucks infographic emphasizes the size and profitability of the coffee retail industry, indicating disruptive innovation opportunities for businesses looking to enter or expand in this market.
- Logo Design
- The simplified logo design approach showcased in The Scale of Starbucks infographic demonstrates the significance and potential disruption of the logo design industry, providing innovative opportunities for businesses specializing in branding and logo development.
- Hospitality and Food Service
- The vast range of drink combinations offered by Starbucks, as depicted in The Scale of Starbucks infographic, highlights the potential for disruptive innovation in the hospitality and food service industries, encouraging businesses to explore unique menu options and customization to attract customers.