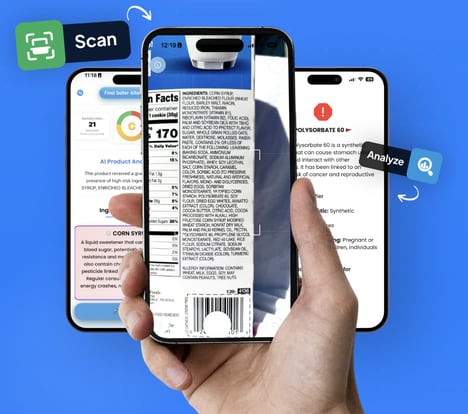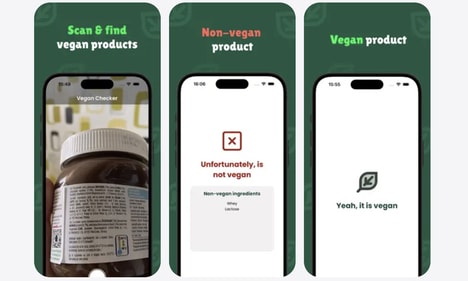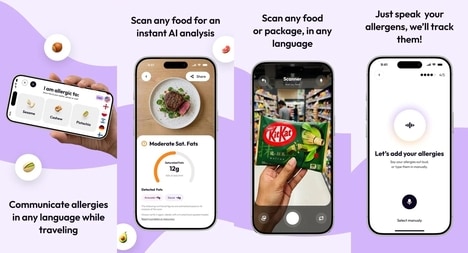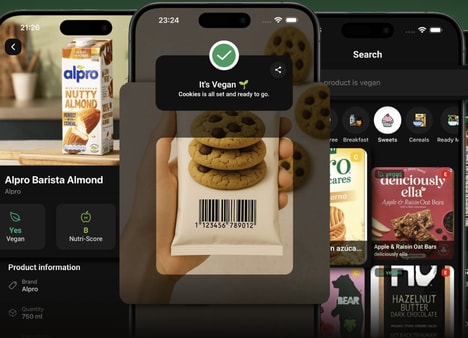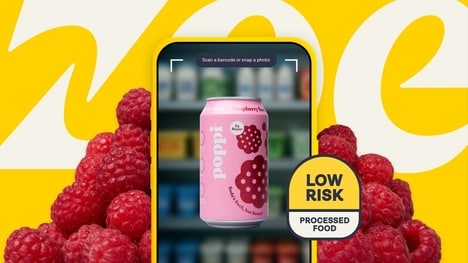
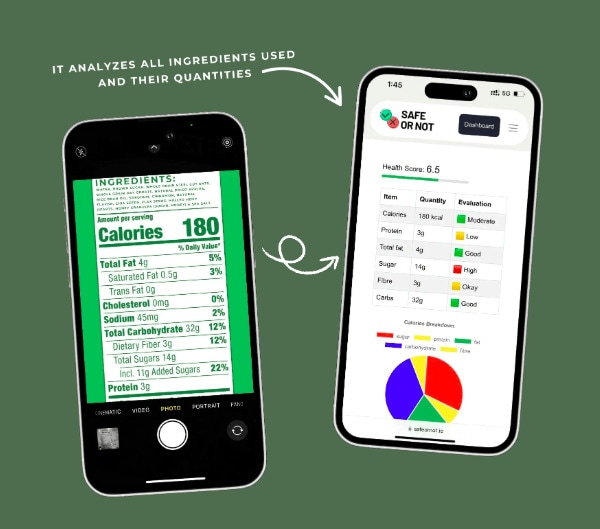
Safe or Not is a mobile application designed to provide quick safety assessments for consumer products through image recognition technology. Users take a photo of a product, and the app scans its ingredients to determine if it is safe to use or consume.
The platform aims to simplify the process of ingredient research by removing the need for manual searches or interpretation of complex labels. This approach can assist consumers in making informed decisions, particularly those with allergies, dietary restrictions, or health concerns. The app’s ease of use and accessibility are emphasized, potentially broadening its appeal to a wide demographic. From a business standpoint, it exemplifies how AI and image recognition can enhance product transparency and consumer safety in retail and personal care industries.
Image Credit: Safe or Not
What's Driving This Trend
- AI-powered Consumer Tools
- AI-driven applications like Safe or Not transform consumer safety and transparency, automating complex research tasks through image recognition.
- Ingredient Transparency
- App innovations that provide ingredient analysis promote greater transparency in product formulation, appealing to health-conscious consumers.
- Personalized Health Monitoring
- By leveraging real-time scanning technology, new tools enable users to verify product safety according to individual health needs, enhancing personalized wellness.
Who This Affects Most
- Retail Technology
- The integration of advanced scanning applications in the retail sector modernizes consumer engagement by offering instant product insights.
- Personal Care
- In the personal care industry, real-time ingredient scanning develops into a valuable feature, catering to the demand for safety and efficacy.
- Health and Wellness
- With the rise of health-focused apps, the health and wellness industry sees a shift towards preventative care through information accessibility.