In order to give us a good visual on the comparison between the salaries of designers vs. developers on a global scale, the Salaries Around the World infographic presents its readers with an interactive map.
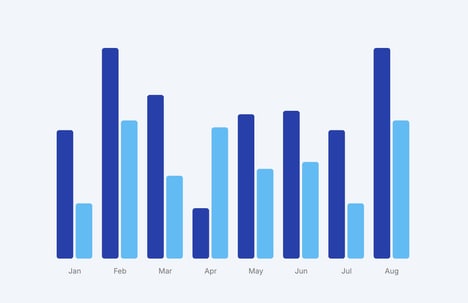
You can click on countries such as Canada, USA, Argentina, Australia and India to get a chart of how much money is made on average doing jobs such as graphic design, web design, software developer and web developer. The design jobs are highlighted in blue shades, while the developers are in green, making it even more easy to see how they compare.
At the bottom of the Salaries Around the World infographic is a summary of all the countries so you can compare pay rates for these jobs between Germany and the Philippines, for example.
What Makes This Trend Stand Out
- Interactive Earning Graphs
- The utilization of interactive graphs in visualizing earnings data for various jobs across different countries around the world.
- Global Salary Benchmarking
- The use of benchmarks to compare salaries of professionals across different countries around the world, providing insight for HR and recruitment initiatives.
- Data Visualization and Insights
- Providing a more accessible and clear view of data for businesses and professionals to understand salary differences at a global level.
Sectors Adopting This
- HR and Recruitment
- The incorporation of interactive earning graphs or data visualization tools to aid in salary benchmarking and recruitment initiatives.
- Finance and Investment
- Providing valuable insight and trends for financial analysts and investors alike regarding financial data on various countries and sectors.
- Education
- Integrating the use of data visualization and interactive earning graphs in finance and economics education.