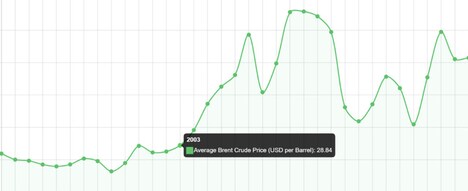
One of the most fundamental concepts surrounding the 2012 Presidential election in the States is how candidates are anticipating spending the tax dollars of the voters. 'Budget by the Numbers' is a handy infographic that boils down the numbers and gives you a snapshot of what the candidates are proposing. Whether you vote based on ideological values or fiscal sense, you can definitely appreciate the clarity of this excellent graph.
The graph compares the Democratic budget (proposed by President Obama) that focuses mainly on spending more, but also creating a higher revenue over the next five years than the opponent GOP budget. The Republicans, however, are proposing less spending and an overall anticipated less deficit over the next five years.
The economy has been widely cited as the number one concern of Americans going into the 2012 election, the Budget by the Numbers graph should help alleviate some of your confusion on the issue.
Key Themes Behind This Trend
- Government Spending Transparency
- The 'Budget by the Numbers' infographic highlights the importance of transparent government spending and presents an opportunity for innovative solutions in this area.
- Ideology Vs. Fiscal Sense
- The comparison of Democratic and Republican budgets in the infographic sparks the need for a balanced approach that combines ideological values with fiscal responsibility.
- Voter Education
- The infographic serves as a tool for educating voters on the economic policies proposed by candidates, opening up opportunities for innovative voter education initiatives.
Where This Applies
- Data Visualization
- The 'Budget by the Numbers' infographic demonstrates the demand for visually engaging and easily comprehensible methods of presenting complex financial data.
- Fiscal Planning
- The comparison of budget proposals in the infographic highlights the potential for disruptive innovation in the field of fiscal planning and budget management.
- Political Campaigns
- The infographic's relevance in the 2012 Presidential election suggests a need for innovative strategies and technologies to effectively communicate candidates' economic plans to voters.