The Google + vs Facebook infographic will help to further divide the lines between the two combating social media sites.
The infographic points out the flaws with both systems while also having a preference for Google +. However, the Google + vs Facebook infographic might not be exactly the best reference to figure out which social media tool to use. Google + is pretty new, so the flaws are yet to be seen. The infographic also points out Google + doesn't have every feature that Facebook has created over the years.
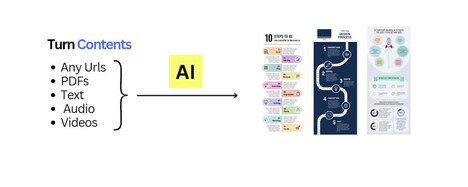
Implications - Audiences want to be able to compare their options. By offering a graphically pleasing and bullet point chart, the audiences feel that they are able to see the important information and learn it quickly to make the best decision for themselves.
Key Themes Behind This Trend
- Comparison of Social Media Platforms
- Developing a visually appealing and informative comparison infographic can help users make informed decisions about which social media platform to use.
- Evaluation of Flaws in Social Media Systems
- Identifying and highlighting the flaws in existing social media systems can create opportunities for disruptive innovation in the development of new platforms.
- Need for Comprehensive Social Media Tools
- As new social media platforms emerge, there is a demand for systems that encompass all the features and functionalities of existing platforms, providing users with a one-stop solution.
Where This Applies
- Social Media Marketing
- Developing effective marketing strategies to promote and differentiate social media platforms based on their strengths and features can be a disruptive innovation opportunity.
- Technology and Software Development
- Creating new social media platforms that address the identified flaws and offer comprehensive features can disrupt the existing industry and capture market share.
- Graphic Design and Information Visualization
- Designing visually appealing and informative infographics or charts that compare social media platforms can serve as a disruptive innovation opportunity in the field of data visualization.