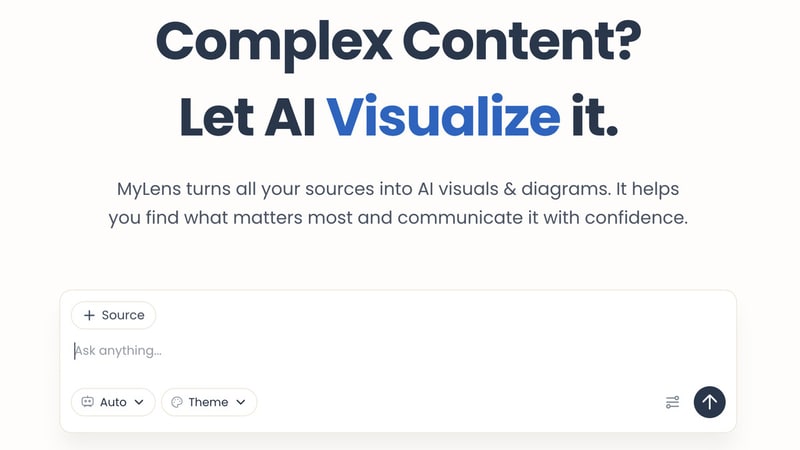
Long documents, videos, and research materials can be difficult to digest, especially when key ideas are buried beneath large amounts of information. MyLens AI transforms content into interactive visual experiences, helping users explore topics through diagrams that highlight relationships, structure, and important concepts.
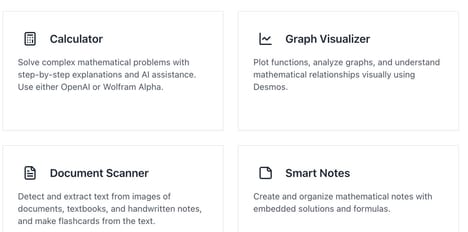
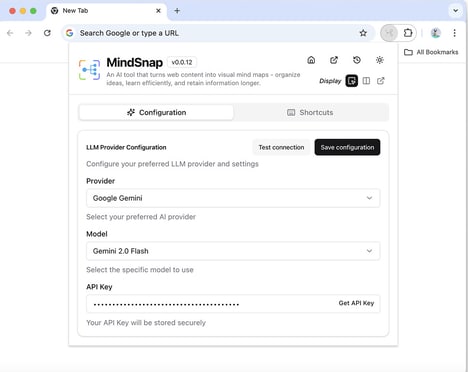
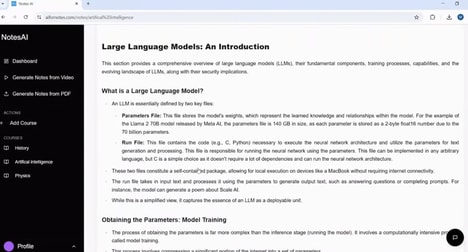
The platform accepts a wide variety of inputs, including text, PDFs, images, webpages, and YouTube videos. Rather than producing a static infographic, MyLens creates editable visuals where users can click into different sections, uncover related concepts, and navigate information through an AI-guided learning path.
MyLens AI is designed for students, educators, researchers, and professionals who want to present or understand complex information more effectively. By converting raw content into connected visual maps, it offers an alternative way to explore ideas that goes beyond traditional note-taking or summarization.
Image Credit: MyLens AI
Key Themes Behind This Trend
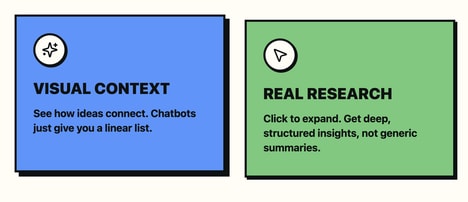
- Interactive Knowledge Maps
- Editable visual diagrams reveal relationships across dense materials, creating room for more intuitive knowledge discovery beyond static summaries.
- Multimodal Content Parsing
- AI systems that interpret PDFs, videos, webpages, images, and text are reshaping how fragmented information becomes structured and searchable.
- Guided Visual Learning
- Personalized navigation paths through complex subjects offer a more adaptive model for education, research, and professional comprehension.
Where This Applies
- Education Technology
- Visual AI study tools support deeper engagement with course materials by turning lectures, readings, and media into explorable learning environments.
- Enterprise Knowledge Management
- Organizations with large document repositories can benefit from AI-generated maps that make institutional knowledge easier to locate, connect, and understand.
- Research and Analytics
- Analysts and researchers gain new ways to synthesize reports, datasets, and source materials through visual interfaces that expose patterns and concept links.