


Nike+ City Runs Create a Visual Display of Runners Using Nike+ Pro
Sarah Nazim — May 19, 2012 — Fashion
References: nikeplus.nike & yesyesno
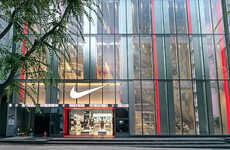
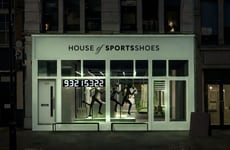
Nike+ City Runs has used the creative firm known as YesYesNo to create visual displays for its Nike retail stores that display a year's worth of running data. The data is collected from the Nike+ website, and the runs displayed are based on three cities: New York, London and Tokyo. The map highlights the runner(s) routes with the OpenFrameworks 3D animation software.
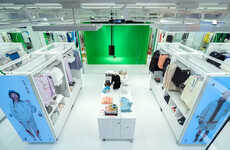
The display concept that Nike is incorporating into its stores is a great visualization of what its products are intended for. By seeing real people using their Nike+ products, it not only promotes active living, but also gives consumers a sense of being part of a larger international community of Nike+ users.
The display concept that Nike is incorporating into its stores is a great visualization of what its products are intended for. By seeing real people using their Nike+ products, it not only promotes active living, but also gives consumers a sense of being part of a larger international community of Nike+ users.
Trend Themes
-
Visual Store Displays — Using visual displays to create unique and immersive shopping experiences for customers.
-
Data Visualization — Utilizing data to create dynamic and engaging visual representations.
-
Community Building — Creating a sense of belonging and community for customers through shared experiences.
Industry Implications
-
Retail — Incorporating digital displays in retail stores to enhance the shopping experience.
-
Technology — Developing innovative software and tools for data visualization.
-
Sports and Fitness — Using technology and data to build a community of active individuals and promote healthy lifestyles.
2.6
Score
Popularity
Activity
Freshness