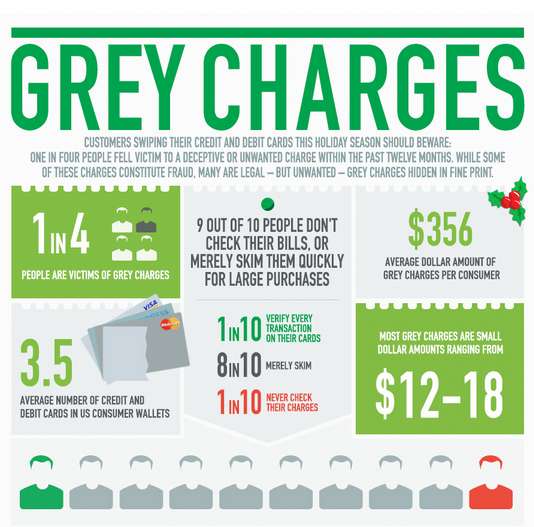
With October 31st just around the corner, many North Americans are rushing to the stores to stock up on Halloween decorations, costumes, and of course, treats—which is just what the CandyNOMics infographic by CreditLoan.com is all about.
While I do love the creepy costumes and scary movies that come with Halloween, the candy is definitely my favorite part of the haunting holiday. Though I’m not surprised to see that Americans spend $1.9 billion annually on Halloween treats, I wouldn’t have guessed that candy corn is the top seller, as the infographic shows. Another surprise from the chart shows that chocolate treats almost double non-chocolate candy sales, meaning good things to come this year for Snickers and Kit Kat lovers!
After seeing the CandyNOMics infographic, I can’t wait to go out there and grab some goodies for myself! May this year’s trick-or-treating be a safe one for all, with plenty of full-sized candy bars to enjoy!
What Makes This Trend Stand Out
- Halloween Treat Spending
- Opportunity for candy manufacturers to innovate and create new, unique treats that capture consumer interest.
- Top Selling Candy
- Opportunity for candy companies to capitalize on the popularity of candy corn and develop new flavors or variations.
- Chocolate Dominance
- Opportunity for chocolate candy brands to continue innovating with new flavors, textures, and packaging to appeal to consumers.
Sectors Adopting This
- Candy Manufacturing
- Disruptive innovation opportunities for candy companies to explore new ingredient combinations, flavors, and packaging designs.
- Retail
- Opportunities for retailers to leverage Halloween candy sales by offering unique promotions, special displays, and exclusive products.
- Advertising and Marketing
- Opportunities for marketers to create innovative campaigns and branding strategies to differentiate candy products and increase sales.