
With the final election results being announced tonight, people all over the world are glued to their media devices, be it television, radio, internet or following Twitter feeds.
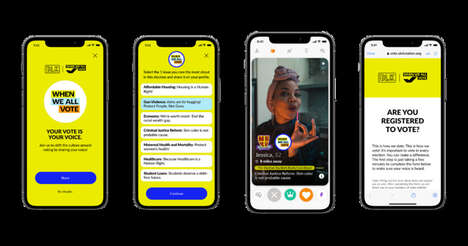
Part of that has included monitoring the polls, specifically scoping out photos and video footage at polling stations around the US.
Until we get the final election results and know who is president, we’ll have to stick with checking out photos like the ones above, care of the New York Times. The prestigious magazine has received a ton of photos from users, then grouped them through an interactive map.
What's Driving This Trend
- Interactive Voter Photo Maps
- Opportunity to develop innovative platforms that allow users to interact with photos and video footage to track election results.
- Monitoring Polls
- Opportunity to create new tools and technologies for tracking and analyzing polling data in real-time.
- User-generated Content
- Opportunity to build platforms that curate user-generated photos and videos to provide unique perspectives on events.
Who This Affects Most
- Media and News
- Opportunity for media outlets to create engaging visual platforms for election coverage and user-generated content.
- Data Analytics
- Opportunity to develop data analytics tools to monitor and analyze polling data in real-time.
- Social Media
- Opportunity for social media platforms to enhance election coverage by integrating user-generated content and interactive features.