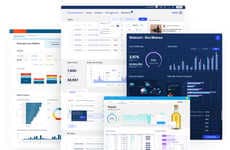

Data storytelling bridges the gap between data collection & actionable insights
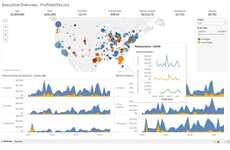
Trend - Data storytelling, which combines data visualization with narrative techniques, is emerging as a powerful method for businesses to comprehend and act upon complex data. The growing trend is fueled by advancements in analytical tools like Tableau and Yellowfin, which have integrated data storytelling features, making them more accessible.
Insight- Organizations are looking to bridge the gap between data collection and actionable insights. Despite collecting large volumes of data, a considerable amount remains unused, underscoring the prominent inefficiencies in data management and the underperformance of traditional analytics. This issue is pushing companies to rethink their strategies for handling data and analytics, with a keen interest in improving their ability to understand data through visualization and storytelling.
Insight- Organizations are looking to bridge the gap between data collection and actionable insights. Despite collecting large volumes of data, a considerable amount remains unused, underscoring the prominent inefficiencies in data management and the underperformance of traditional analytics. This issue is pushing companies to rethink their strategies for handling data and analytics, with a keen interest in improving their ability to understand data through visualization and storytelling.
Workshop Question - How can your brand use storytelling to unlock insights and drive action?
Trend Themes
1. Data Storytelling - Advancements in analytical tools like Tableau and Yellowfin are fueling the growing trend of data storytelling, bridging the gap between data collection and actionable insights.
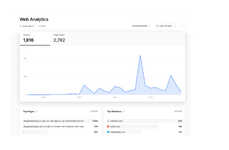
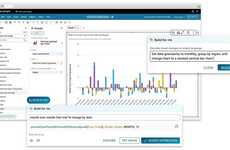
2. Cloud-based AI Tools - Cloud-based AI tools like Amazon Quicksight offer disruptive innovation opportunities by providing generative AI capabilities and enabling natural language queries for fast analysis and visualization.
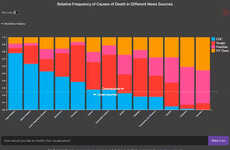
3. AI Data-interpreted Graphics - Vizzy's AI data interpretation capabilities empower users to transform raw data into visually engaging graphics, simplifying the process of presenting complex information effectively.
Industry Implications
1. Business Intelligence - The business intelligence industry can capitalize on data storytelling trends to enhance decision-making processes and drive better insights across organizations.
2. Data Visualization - In the field of data visualization, leveraging cloud-based AI tools like Amazon Quicksight can revolutionize how data is analyzed, interpreted, and shared in a scalable and cost-effective manner.
3. Content Creation - Content creators and marketers in the content creation industry can explore AI data-interpreted graphics tools like Vizzy to transform data into visually compelling graphics that enhance audience engagement and understanding.

