


Lumascape Organizes Visual Example of Complex Marketing Measures
References: businessinsider & slideshare.net
With more technological platforms developing, companies face an increase in the number of target market niches. California-based brand Lumascape alarmed the public with a graphic representation of its insane marketing measures.
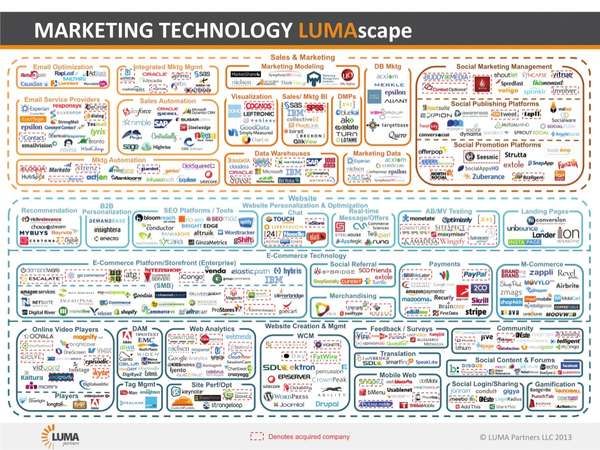
The graph is divided into two major sections: sales and marketing, and website. Within the website sector, there are three key divisions: personalization and optimization, e-commerce technology and website creation and management. Within each of those are seven to 15 sub-category pockets containing numerous logos of partnering companies.
This organized diagram of Lumascape’s practices make us realize just how focused and complex the technology world is. It breaks down a company’s many different components of marketing to map out business practices.
Though this graph is a bit eye-straining, it is a colorful and relatively simple visual representation of the happenings of a company. After all, lists can get tedious after the 50th item; why not compile actions in one graphic?
1.9
Score
Popularity
Activity
Freshness